Function Graph
Linear and Quadratic Functions: An Overview
Linear and quadratic functions are fundamental concepts in algebra, each with unique characteristics, behaviors, and visual representations.
Linear Functions
A linear function is typically represented by the equation 
is the slope, indicating the angle or steepness of the line.
is the y-intercept, where the line crosses the y-axis.
Key Characteristics of Linear Functions:
- Ascending/Descending: The slope
, the line is horizontal.
- Angle: The angle or steepness of the line increases with the absolute value of
- Crossing the x-axis: To find where the line crosses the x-axis (the root), set
and solve for

Linear functions produce a straight line with a constant slope, indicating a steady rate of change.
Quadratic Functions
A quadratic function is generally represented by the equation 
,
are constants, with
(if
, the function is linear).
- The function forms a parabola, a symmetrical, curved shape.
Key Characteristics of Quadratic Functions:
- Direction of the Parabola: The coefficient
, the parabola opens upwards (concave up); if
, it opens downwards (concave down).
- Vertex: The vertex of the parabola is its maximum or minimum point, depending on the direction of opening. The x-coordinate of the vertex is given by
, and substituting this back into the function gives the y-coordinate, yielding the vertex
.
- Axis of Symmetry: The line x=−b2ax = -\frac{b}{2a}x=−2ab is the axis of symmetry, dividing the parabola into two mirror-image halves.
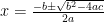
- Roots (x-intercepts): To find where the parabola crosses the x-axis, set
using the Bhaskara formula (also known as the quadratic formula):